Chip Equipment Sales 2026: Applied Materials US Revenue Doubles as China’s Share Shrinks
Applied Materials and Lam Research grew 53 and 54 percent. China still buys more, but its share is falling while US, Korea and Europe tool spending surges, and the tool makers say demand beats supply into 2028.

Applied Materials sold $10.41 billion of chipmaking equipment and services in the quarter that ended October 25, up 53 percent from a year earlier. Lam Research, reporting a month earlier, grew 54 percent. Both companies called them record quarters. The more useful number is where the tools went. Applied’s revenue from US customers doubled to $1.32 billion. Its China revenue grew too, but China’s share of sales fell from 28.9 percent to 25.4 percent. At Lam, China’s share dropped from 43 percent to 35 percent in a year.
The claim of this piece: the AI buildout has turned the chip equipment business from a China story into a capacity story. Every major region is buying more tools, the fastest growth is now outside China, and the people who make the tools are telling investors that demand runs ahead of what they can ship. For anyone in the supply chain behind a fab, that changes who the customer is and how long the queue gets.
The evidence: where the tool money went
Applied Materials breaks out revenue by customer location in its fourth quarter fiscal 2026 earnings release, filed with the SEC on November 12. The table below rebuilds those figures and adds two columns the release does not show: each region’s share of the quarter and its growth rate. Shares and growth are our math from Applied’s reported dollar figures.
| Region | Q4 FY2026 revenue ($M) | Q4 FY2025 revenue ($M) | Change | Share now | Share a year ago |
|---|---|---|---|---|---|
| Taiwan | 2,916 | 1,834 | +59.0% | 28.0% | 27.0% |
| China | 2,642 | 1,964 | +34.5% | 25.4% | 28.9% |
| Korea | 1,811 | 1,219 | +48.6% | 17.4% | 17.9% |
| United States | 1,320 | 655 | +101.5% | 12.7% | 9.6% |
| Japan | 619 | 448 | +38.2% | 5.9% | 6.6% |
| Southeast Asia | 581 | 460 | +26.3% | 5.6% | 6.8% |
| Europe | 520 | 220 | +136.4% | 5.0% | 3.2% |
| Total | 10,409 | 6,800 | +53.1% | 100% | 100% |
Source: Applied Materials Q4 FY2026 earnings release (SEC Form 8-K, Exhibit 99.1). Regions sum to the reported total in both periods.
Three things stand out. First, Applied’s revenue outside China rose 60.6 percent, from $4.84 billion to $7.77 billion, while China rose 34.5 percent. Second, US revenue added $665 million in one year, nearly as much as China’s $678 million increase, from a base one third the size. Third, Europe more than doubled from a small base. Taiwan, home to the leading edge foundries, is now Applied’s largest market.
The product mix tells the same story. In Applied’s Semiconductor Systems segment, which is the tool business without service, revenue rose to $7.996 billion from $4.879 billion, up 63.9 percent. DRAM went from 28 percent of that segment to 33 percent. Using Applied’s rounded percentages, that puts DRAM tool revenue at roughly $2.6 billion for the quarter, close to double the roughly $1.4 billion a year earlier. On the call, as reported by 247 Wall St, Dickerson said more than 85 percent of the silicon in an AI data center is leading edge logic, DRAM and advanced packaging. The memory makers are buying accordingly.
Lam shows the same shift, faster
Lam Research is the etch and deposition specialist, and by its own numbers it is the more China exposed of the two. Its results for the quarter ended September 27, 2026 and its results for the same quarter of 2025 let us put the two side by side.
| Measure | Applied Materials | Lam Research | KLA |
|---|---|---|---|
| Quarter ended | Oct 25, 2026 | Sep 27, 2026 | Sep 30, 2026 |
| Revenue, latest quarter | $10.41B | $8.22B | $4.14B |
| Revenue, same quarter a year earlier | $6.80B | $5.32B | $3.21B |
| Year over year growth | +53.1% | +54.4% | +28.9% |
| China share, latest quarter | 25.4% | 35% | Not in release |
| China share, a year earlier | 28.9% | 43% | Not in release |
| US share, latest vs year earlier | 12.7% vs 9.6% | 8% vs 6% | Not in release |
| Next quarter revenue guide (midpoint) | $11.1B | $8.60B | $4.7B |
Sources: company earnings releases filed with the SEC. Applied shares computed from reported dollars; Lam shares as reported (rounded); growth rates computed from reported revenue. KLA release from October 28, 2026.
Lam’s China revenue still grew in dollars. Applying its rounded shares to its revenue gives roughly $2.88 billion from China in the September 2026 quarter against roughly $2.29 billion a year earlier, a gain of about 26 percent. Korea did far better: its share went from 15 percent to 20 percent, which works out to roughly double the dollars. Lam’s systems revenue, the new leading edge tools, rose 61.6 percent to $5.73 billion, while customer support and older Reliant tools rose 40.0 percent.
Put Applied and Lam together and the pattern is plain. Across the two companies’ latest quarters, combined revenue was about $18.6 billion, up 53.6 percent. Combined China revenue was about $5.5 billion, up roughly 30 percent. China is still the single biggest market for Lam and the second biggest for Applied. It is just no longer where the growth is.
KLA, which makes inspection and measurement systems, does not split revenue by region in its release, so we leave those cells empty rather than guess. Its revenue grew 28.9 percent and it guided the December quarter to $4.7 billion, plus or minus $200 million, which would be a step up of about 14 percent from September.
The tool makers say supply is the limit
The most important sentence of the season came from Europe, not the US. In its third quarter release on October 14, ASML, the Dutch lithography maker, said: “we now expect that our supply as currently planned for both 2027 and 2028 will not fully meet the demand of our customers.” It added that some customers want to place orders for 2029 and even 2030, and that it is investigating ways to add capacity for 2028 beyond the 30 percent increase it had already announced. ASML guided fourth quarter sales to between 14.2 and 15.2 billion euros, against 11.7 billion euros in the third quarter.
Applied said much the same on its November 12 call. According to 247 Wall St’s account of the call, CEO Gary Dickerson said demand for advanced semiconductors remains “much higher than supply” and that wafer fab equipment demand should rise more than 30 percent in 2027. CFO Brice Hill said clean room space is a limiting factor on how many tools the industry can install, that Applied is tracking more than 20 fab ramps and line expansions in 2027, and that China will probably be under 25 percent of Applied’s business in 2027. In the release itself, Dickerson said Applied is on track to grow Semiconductor Systems more than 40 percent in calendar 2026.
What it means on the ground
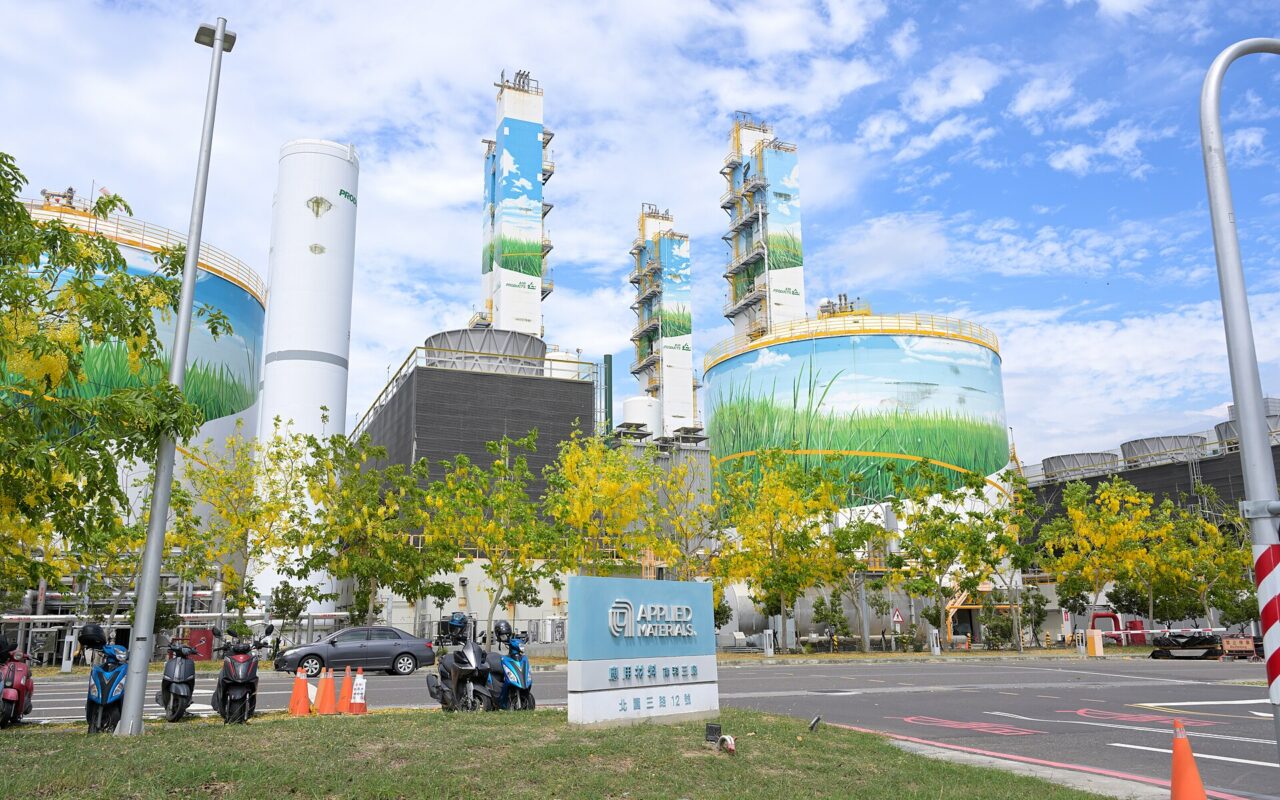
Start with the buildings. If clean room space, not tool supply, is the first constraint Applied names, then the bottleneck has moved upstream into construction: air handling, ultrapure water, chemical delivery, gas plants and the electrical gear that feeds them. The featured photo for this piece is a small picture of that. It shows Applied’s sign next to an industrial gas plant in the Southern Taiwan Science Park, because a fab is only as fast as the utilities around it.
Second, the customer list is changing. A tool maker whose biggest growth customers are in the US, Korea and Europe ships differently than one selling into Chinese domestic fabs. Installation crews, spare parts depots, field service engineers and export paperwork all follow the revenue. Applied’s US revenue doubling in a year is a staffing and logistics problem before it is a profit line.
Third, the memory makers are back at the front of the line. DRAM growing from 28 percent to 33 percent of Applied’s tool sales in a year, and Korea’s share jumping at Lam, most likely points at memory for AI servers. Tool revenue is some of the earliest hard evidence of how much memory capacity is coming.
Brandon’s Take
From the tooling side, a 64 percent jump in Applied’s systems revenue in one year is the number I would stare at. Equipment makers do not build that many more tools by working harder on the same floor. They pull harder on their own suppliers: machined chamber parts, precision weldments, ceramics, valves, wafer handling components, cable harnesses. Those suppliers are mostly small and mid size shops, and most of them do not get two years of warning. When the top of the chain says demand beats supply into 2028, the queue forms several tiers down first.
The China numbers deserve a careful reading. China did not stop buying. Its dollars grew at both companies. What changed is that the rest of the world started spending at AI speed, while US export rules, which KLA lists as a risk to its sales to certain customers in China, cap what the newest tools can do there. For a buyer or a supplier, the practical question is not whether China is in or out. It is whether your capacity planning still assumes the old customer mix.
And one caution on the money side. This is a cyclical business; KLA names “the cyclicality of the industries in which we operate” among its own risk factors. The difference this time is that the companies are describing a supply limit, not a demand peak. That is a sourced claim from the companies themselves, not a forecast from us, and it is the thing to test each quarter.
What to watch
- Applied’s 14 week quarter. Applied guided the January quarter to $11.1 billion, plus or minus $500 million, and 247 Wall St reports the quarter has 14 weeks. If the October quarter ran the usual 13 weeks, the guide midpoint is about $793 million a week against about $801 million a week just reported. Read the January result per week, not just as a headline.
- China under 25 percent. Hill’s 2027 comment, as reported, would put China below its 25.4 percent share in the latest quarter. Watch whether that comes from slower China spending or faster spending everywhere else. The answer matters for export policy and for which service networks grow.
- ASML’s 2028 capacity decision. ASML said it is investigating capacity beyond its planned 30 percent increase. Any firm number there sets a ceiling on how much leading edge capacity the industry can add in 2028.
- Clean room starts. If clean room space is the limiter, fab construction starts and utility contracts in the US, Korea, Taiwan and Japan are the leading indicator for tool shipments a year out.
- Lam and KLA December quarters. Lam guided $8.60 billion and KLA $4.7 billion. Both report in January. Lam’s region table will show whether Korea and the US keep gaining share.
For the power side of the same buildout, see our deep analysis on the gas turbine shortage and what AI data centers now pay per kilowatt.
Sources
- Applied Materials, Q4 and fiscal 2026 results, Exhibit 99.1 to Form 8-K, November 12, 2026
- Lam Research, results for the quarter ended September 27, 2026, Exhibit 99.1 to Form 8-K, October 21, 2026
- Lam Research, results for the quarter ended September 28, 2025, Exhibit 99.1 to Form 8-K
- KLA, fiscal 2027 first quarter results, Exhibit 99.1 to Form 8-K, October 28, 2026
- ASML, Q3 2026 results, Exhibit 99.1 to Form 6-K, October 14, 2026
- 247 Wall St, “Applied Materials Says Chip Demand Remains Much Higher Than Supply,” November 13, 2026
Get The Benderson Brief in your inbox every weekday morning. Follow @bendersonmedia on X for the daily charts.

Brandon Henderson
Brandon Henderson founded Benderson Media. He has spent more than 15 years in custom injection molding, tooling and global manufacturing, working with factories in China and Vietnam on programs for aerospace and consumer brands. He is a journeyman tool and die maker, CPSP certified, and a Six Sigma Green Belt. Benderson Media covers AI in the real economy: the factories, chips, power and money behind it.
Get The Benderson Brief
Five stories on robots, chips, power and AI money every weekday morning. Free. One click to leave.
Every figure in this piece links to its source. See our editorial standards. Nothing here is investment advice.